About the Lab
Our primary research interests are:
1. Early stages of species evolution. Isolating barriers between species and evolutionary genetics of quantitative traits.
2. Molecular evolution of the promoter region and regulatory sequences of conserved genes and an evolutionary role of transposable elements.
Lab members

Alexey Kulikov

Oleg Lazebny

Nikolay Gornostaev

Svetlana Sorokina

Alexander Fokin
Elena Belkina

Galina Zotova

Tatyana Ivanova

Prohor Proshakov

Lilia Revyakina
Research fields
Topic 1. Isolating barriers and evolutionary genetics of quantitative traits.
1a. Evolution of the copulatory apparatus shape in related species.
Key publication: Kulikov AM, Sorokina SY, Melnikov AI, Gornostaev NG, Seleznev DG, Lazebny OE. The effects of the sex chromosomes on the inheritance of species-specific traits of the copulatory organ shape in Drosophila virilis and Drosophila lummei. PLoS One. 2020 Dec 29;15(12):e0244339. doi: 10.1371/journal.pone.0244339.
The shape of the male genitalia in many taxa is the most rapidly evolving morphological structure, often driving reproductive isolation, and is therefore widely used in systematics as a key character to distinguish between sibling species. However, only a few studies have used the genital arch of the male copulatory organ as a model to study the genetic basis of species-specific differences in the Drosophila copulatory system. Moreover, almost nothing is known about the effects of the sex chromosomes on the shape of the male mating organ. In our study, we used a set of crosses between D. virilis and D. lummei and applied the methods of quantitative genetics to assess the variability of the shape of the male copulatory organ and the effects of the sex chromosomes and autosomes on its variance. Our results showed that the male genital shape depends on the species composition of the sex chromosomes and autosomes. Epistatic interactions of the sex chromosomes with autosomes and the species origin of the Y-chromosome in a male in interspecific crosses also influenced the expression of species-specific traits in the shape of the male copulatory system. Overall, the effects of sex chromosomes were comparable to the effects of autosomes despite the great differences in gene numbers between them. It may be reasonably considered that sexual selection for specific genes associated with the shape of the male mating organ prevents the demasculinization of the X chromosome.

Fig. 1. Outline of the copulatory system with a suite of morphometric parameters (MP) measured in males of the Drosophila virilis and D. lummei species, F1, F2 of the interspecies crosses and backcrosses.(A) Line segments with corresponding numbers of the same color are grouped according to their weight in a particular latent factor. The color-coding notation of the first seven latent factors and a group of highly specific MPs is located in the lower left-hand corner of the drawing. The number of the main MP1 is placed in a circle. The angle’s alpha and beta indicate the angles of deviation of the hook and apodeme from the copulatory organ’s central axis. (B) The main parts of the male copulatory organ are shown in the inset in the upper right-hand corner. (C) Photos of the male copulatory organ in D. virilis, D. lummei, and their hybrid.
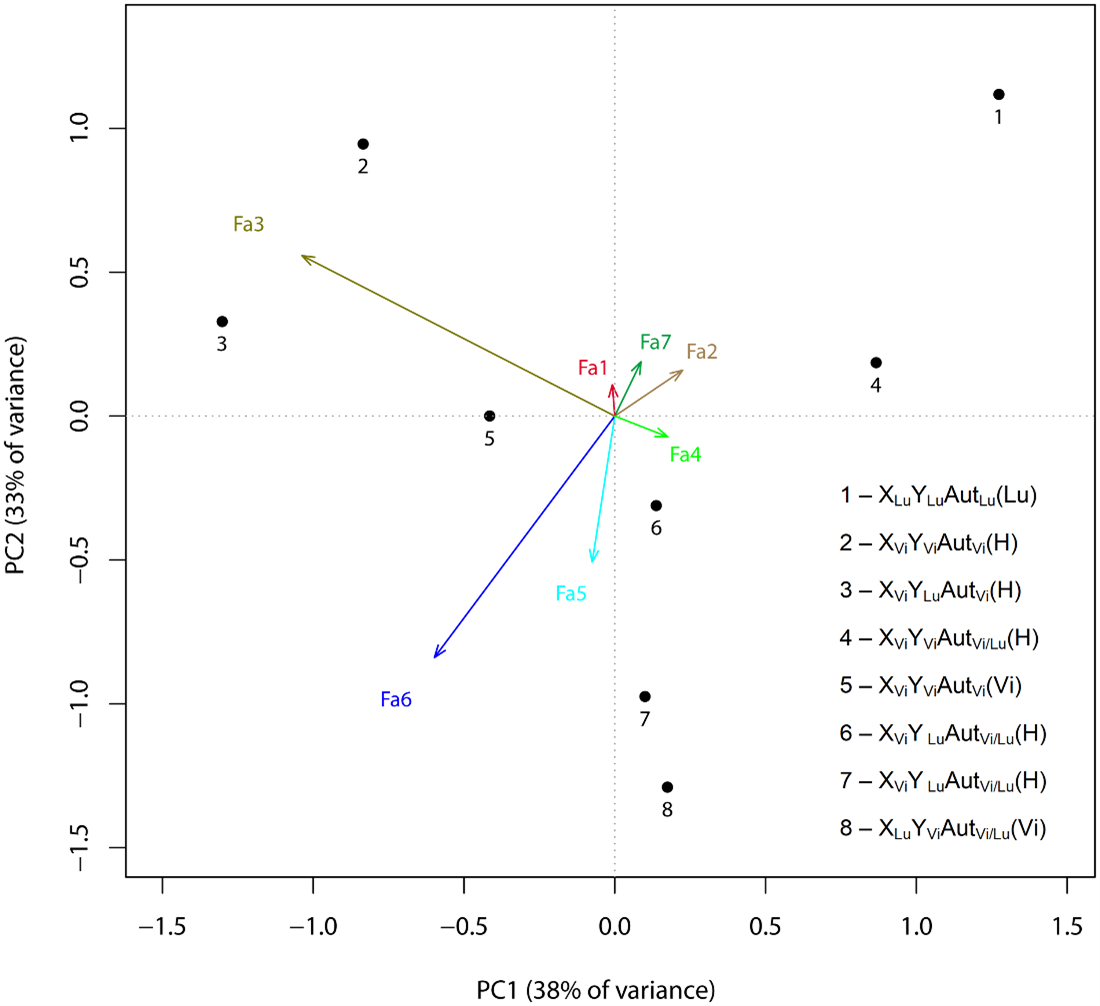
Fig. 2. Redundancy analysis: Association of factor structure values and genotypes. Based on the traits with the greatest factor loadings, the factors were classified as follows.Factor 1 (Fa1) characterized the variation in the width of the apodeme outline;Factor 2 (Fa2) characterized the variation in the traits related to the apodeme bend;Factor 3 (Fa3) included the most distinct species-specific traits and characterized the variation in (a) the shape of the ventral bend in the distal part of the aedeagus outline, (b) the position of the dorsal bend of the aedeagus outline relative to the central point, and (c) paramere lengths;Factor 4 (Fa4) characterized the variation in traits related to the ventral bend in the proximal part of the aedeagus;Factor 5 (Fa5) characterized the variation in traits related to the height of the dorsal bend of the aedeagus outline; Factor 6 (Fa6) characterized the variation in the hook angle and the apical part of the aedeagus outline; and Factor 7 (Fa7) characterized the variation in traits related to the dorsal bend in the distal part of the aedeagus outline and the lowermost point of the ventral bend in the same aedeagus part. IMP 3, 18, 19, 23, 24, 26, 27, and 28 were highly specific (Table 3, highly specific). Numbers denote particular genotypes: 1, XLuYLuAutLuLu (parent male was a D. lummei male); 2, XViYViAutViVi/Lu (parent male was a hybrid F1 male with a set of XViYLu sex chromosomes or with the opposite set of sex chromosomes, XLuYVi); 3, XViYLuAutViVi/Lu (parent male was a hybrid F1 male with a set of XViYLu sex chromosomes or with the opposite set of sex chromosomes, XLuYVi); 4, XViYViAutVi/LuVi/Lu (parent male was a hybrid F1 male with a set of XViYLu sex chromosomes or with the opposite set of sex chromosomes, XLuYVi); 5, XViYViAutViVi (parent male was a D. virilis male); 6, XViYLuAutVi/LuVi/Lu (parent male was a hybrid F1 male with a set of XViYLu sex chromosomes or with the opposite set of sex chromosomes, XLuYVi); 7, XViYLuAutVi/LuLu (parent male was a D. lummei male); 8, XLuYViAutVi/LuVi (parent male was a D. virilis male).
1b. Courtship ritual and reproductive isolation.
Key publication: Belkina EG, Seleznev DG, Sorokina SY, Kulikov AM, Lazebny OE. The Effect of Chromosomes on Courtship Behavior in Sibling Species of the Drosophila virilis Group. Insects. 2023 Jul 5;14(7):609. doi: 10.3390/insects14070609. PMID: 37504615; PMCID: PMC10380318.
Prezygotic isolation mechanisms, particularly courtship behavior, play a significant role in the formation of reproductive barriers. The action of these mechanisms leads to the coexistence of numerous closely related insect species with specific adaptations in a shared or adjacent territory. The genetic basis of these mechanisms has been studied using closely related Drosophila species, such as the D. virilis group. However, the investigation of individual courtship behavior elements has been limited until recently, and the effect of genotype on the species-specific features of courtship as a whole has not been thoroughly examined. It should be noted that courtship behavior is not a typical quantitative trait that can be easily measured or quantified in both females and males, similar to traits like wing length or bristle number. Each courtship element involves the participation of both female and male partners, making the genetic analysis of this behavior complex. As a result, the traditional approach of genetic analysis for quantitative traits, which involves variance decomposition in a set of crosses, including parental species, F1 and F2 hybrids, and backcrosses of F1 to parental species, is not suitable for analyzing courtship behavior. To address this, we employed a modified design by introducing what we refer to as 'reference partners' during the testing of hybrid individuals from F1, F2, and backcrosses. These reference partners represented one of the parental species. This approach allowed us to categorize all possible test combinations into four groups based on the reference partner's sex (female or male) and their constant genotype towards one of the parental species (D. virilis or D. americana). The genotype of the second partner in the within-group test combinations varied from completely conspecific to completely heterospecific, based on the parental chromosomal sets. To assess the contribution of partner genotypes to the variability of courtship-element parameters, we employed structural equation modeling (SEM) instead of the traditional analysis of variance (ANOVA). SEM enabled us to estimate the regression of the proportion of chromosomes of a specific species type on the value of each courtship-element parameter in partners with varying genotypes across different test combinations. The aim of the current study was to analyze the involvement of sex chromosomes and autosomes in the formation of courtship structure in D. virilis and D. americana. The genetic analysis was complemented by video recording and formalization of courtship-ritual elements. D. virilis was found to be more sensitive to mate stimuli compared to D. americana. The majority of species-specific parameters, such as latency and duration of courtship elements (e.g., male and female song, following, licking, and circling), were shown to be influenced by the D. virilis genotype. However, not all of these parameters significantly impact copulation success, with the male song, licking, and following being the most significant. In females, the female song was found to have a significant relationship only with copulation duration. The influence of the female genotype on the species-specific parameters of courtship elements is primarily related to autosomes, while the male genotype is associated with the X chromosomes. The study suggests that sexual selection primarily occurs through acoustic and chemoreceptor channels.
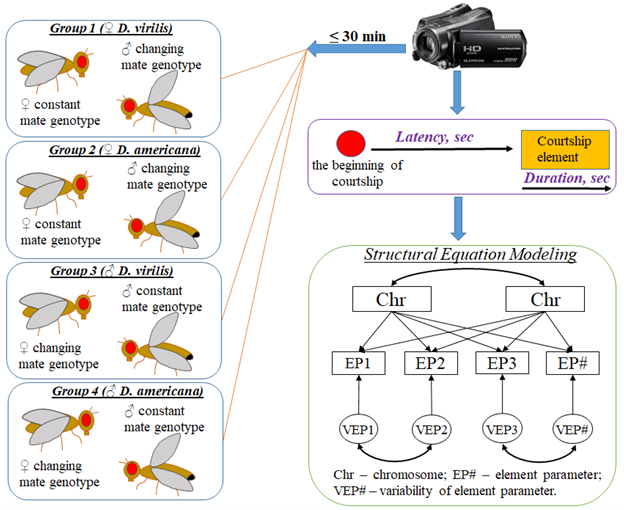
Fig. 3. Experimental Design. Experiments were grouped based on a specific rule: one partner with a consistent parental genotype, referred to as the partner with a constant genotype and another partner with a genotype that varied from conspecific to heterospecific across a series of experiments. The courtship ritual was captured using a video camera and subsequent video analysis allowed for the identification and separation of individual courtship elements. The genetic analysis of courtship behavior traits involved the integration of various methods, including structural equation modeling (SEM).
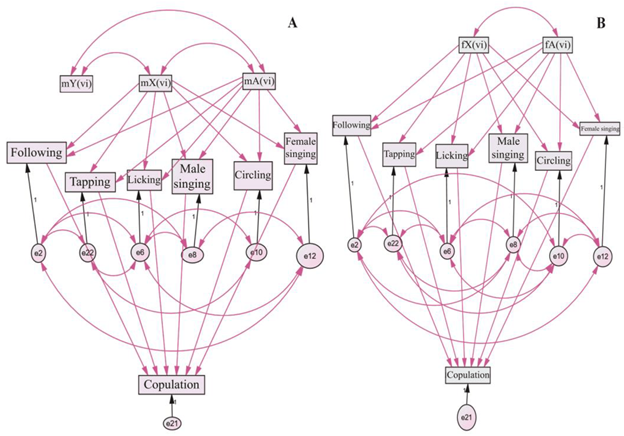
Fig. 4. Genetic variability models of courtship-ritual element latency traits in pooled pairs with a partner of constant genotype: (A) D. virilis females and (B) D. virilis males. Key: m—male; f—female; X, Y—sex chromosomes; A—autosomes; vi—D. virilis. Double-sided arrows represent correlations and potential mutual regulatory interactions between the elements. One-sided arrows indicate the regulatory influence of higher elements on lower ones. Violet arrows denote optional connections, while black arrows indicate required connections. Rectangles represent external and internal variables, while circles denote the variability of dependent or internal variables. The symbols e2–e22 represent sets of variables that characterize the variability of internal variables.

Fig. 5. Effect of the proportion of D. virilis chromosomes in one courtship partner on the latency of courtship elements with the other partner having a constant D. virilis genotype: (A) Genotypes change in males while females have a D. virilis genotype (Group 1); (B) Genotypes change in females while males have a constant D. virilis genotype (Group 3)
Topic 2. Molecular evolution of the promoter region and regulatory sequences of conserved genes and the role of transposable elements.
Key publication: Chekunova A.I., Sorokina S.Yu., Sivoplyas E.A., Bakhtoyarov G.N., Proshakov P.A., Fokin A.V., Melnikov A.I., Kulikov A.M. Episodes of Rapid Recovery of the Functional Activity of the ras85D Gene in the Evolutionary History of Phylogenetically Distant Drosophila Species//Front. Genet. 2022. DOI: 10.3389/fgene.2021.807234.
As assemblies of genomes of new species with varying degrees of relationship appear, it becomes obvious that structural rearrangements of the genome, such as inversions, translocations, and transposon movements, are an essential and often the main source of evolutionary variation. In this regard, the following questions arise. How conserved are the regulatory regions of genes? Do they have a common evolutionary origin? And how and at what rate is the functional activity of genes restored during structural changes in the promoter region? In this article, we analyze the evolutionary history of the formation of the regulatory region of the ras85D gene in different lineages of the genus Drosophila, as well as the participation of mobile elements in structural rearrangements and in the replacement of specific areas of the promoter region with those of independent evolutionary origin. In the process, we substantiate hypotheses about the selection of promoter elements from a number of frequently repeated motifs with different degrees of degeneracy in the ancestral sequence, as well as about the restoration of the minimum required set of regulatory sequences using a conversion mechanism or similar.

Fig. 6. Polymorphism of the intergenic region, promoter, 5′UTR, and intron 1 in Drosophila species with different degrees of relationship. Scheme of the distribution of evolutionarily conserved sequences and insertion-deletion polymorphism in the analyzed region of the ras85D gene. The structure of evolutionarily conserved sequences which were obtained using the MEME algorithm. In the scheme, the boxes above the line show the location of ECMs on the plus strand, while the boxes below the line show ECM location on the minus-strand. The reduced box height marks degenerate ECMs. The upper part shows species of the subgenus Drosophila (D. virilis—D. albomicans), and in the lower part, there are species of the subgenus Sophophora (D. willistoni—D. melanogaster). D. busckii (subgenus Dorsilopha) is located between the subgenera Drosophila and Sophophora.

Fig. 7. Distribution of the identified transposon insertion events on the evolutionary tree of the analyzed Drosophila species. The phylogenetic tree was constructed using the Maximum Likelihood method on the base of the Tamura 3-parameter model. Sequences of exons and 3′UTR of the ras85D gene of 37 Drosophila species were used. Gamma distribution was used to model evolutionary rate differences among sites [5 categories (+G, parameter = 0.8107)]. The rate variation model allowed some sites to be evolutionarily invariable [(+I), 19.28% sites]. The structure of the resulting phylogenetic tree is generally consistent with the species tree obtained for 155 genomes of Drosophila species (Suvorov et al., 2021) excluding D. willistoni, for which the position on the species tree is indicated by a dashed line. The callouts specify the transposable element and insertion events on the branches of the evolutionary tree. Callout-designated insertions in the following regions: intergenic region, promoter, 5′UTR, and intron 1, were highlighted in black, blue, purple, and orange, respectively.

Fig. 8. The minimal number of rearrangements required to transform the ancestral state of chromosome 2 to specific for the virilis group. Blue and red arrows—the inverted repeats Ir-a and Ir-b, respectively, that marked insertion sites of two copies of the Uncharacterized X DNA Transposon into the ras85D—Rlb1 and CG31344—Caf1-55 intergenic regions in the ancestor of the virilis species group. DAIBAM elements are colored with yellow (inverted terminal sequences) and gray (Reis, et al., 2018). Remnants of ancestral sequences are colored with light blue. The nomenclature of the genes corresponds to the names of D. melanogaster orthologs. The representation is not to scale.

Fig. 9. Patterns of promoter elements in the TSS regions of the ras85D gene and its orthologs in the studied Drosophila species. The scale below the line shows the position from the start of the overall alignment. The colored boxes represent promoter elements. Elements shown under the straight line indicate homology with the DNA minus strand. TSS are marked with arrows. The upstream gene is marked on the left side of the diagrams.